

图表内容
图1:先验分布下夏普比率最高的成长型基金的投资组合
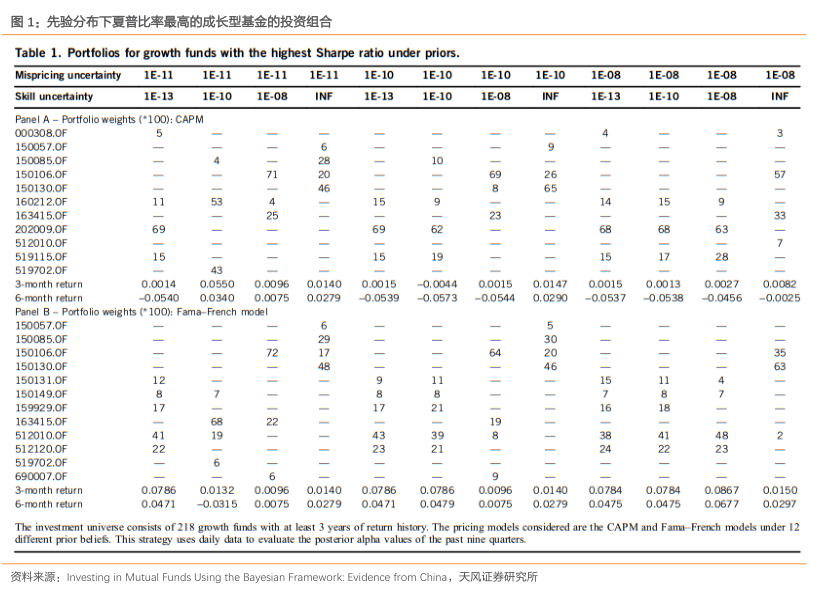
Table l. Portfolios for growth funds with the highest sharpe ratio under priors
Mispricing uncertainty lEl1
1E-1
1E111E.10
1E10
1E101E10
1E08
Skill uncertainty
1E101E.08
1E-13
E-10
INF
1E13
1E-10
Panel A-Portfol io weights(100): CAPM
50057
0
150106OF
1501300F
634150F
202009.0
2010.0F
519702.0F
05500.00960.014000015-0.0044000150.0147000150.00130.00270.0082
month return
0.03400.00750.0279-00539
0573-005440.0290-00537
0538-00456=0.0025
anel B- Portfo lio weights (100): Fama-French mode
1500570F
150085.0F
50130.0F
50131.OF
59929
0
63415.0F
2010.0F
19702
0F
90007.0F
3-month return
000960.01400.0
0.0786
0.0150
6-month return
00471-0.03150.00750.02790.0471
The investment universe consists of 218 growth funds with at least 3 years of return history. The pricing models considered are the CAPM and Fama-French models under 12
different prior beliefs. This strategy uses daily data to evaluate the posterior alpha values of the past nine quarte
资料来源
al funds
China
证券研究所

