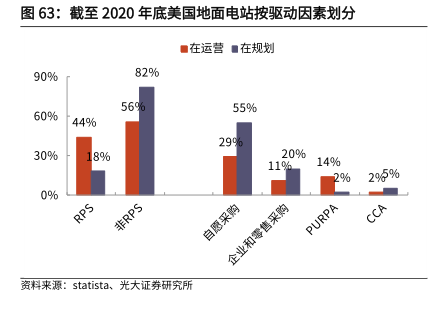
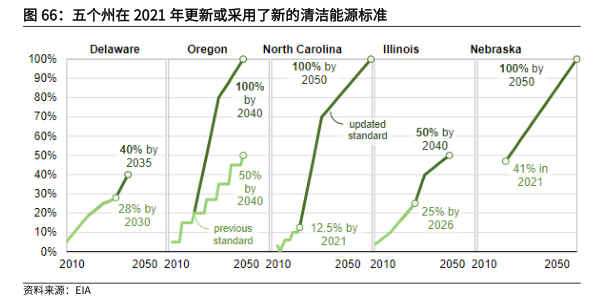
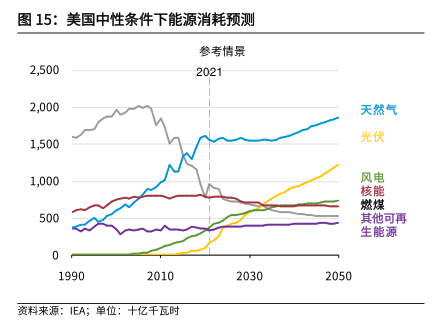
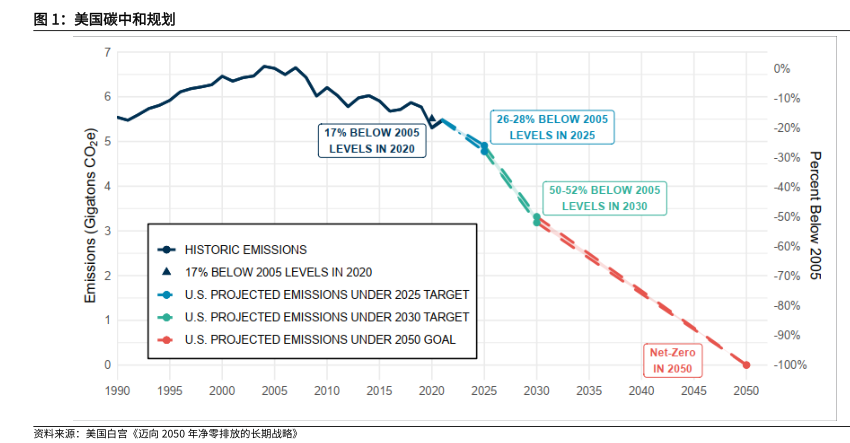
图表内容 图63:截至2020年底美国地面电站按驱动因素划分 ■在运营■在规划 90% 82% 55% 60% 44% 30% 8% 20% 11% 14% 2% 0% RPS 非RPS 企业和零售采购 PURPA CCA 资料来源:statista、光大证券研究所