


图表内容
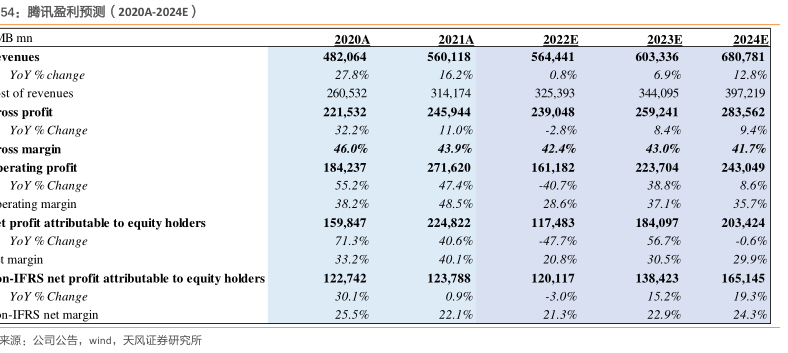
54:腾讯盈利预测(2020A-2024E
B mn
2020A
2022E
2023E
2024E
venues
482
064
560
118
564
441
603
336
680
781
YoY change
27.8%
16.2%
0.8%
6.9%
12.8%
st of revenues
260
532
314.174
325
393
344.095
397
219
oss profit
221
532
245
944
239
048
259
241
YoY Change
32.2%
11.0%
-2.8%
8.4%
9.4%
oss margin
46.0%
43.9%
42.4%
43.0%
41.7%
erating profit
184
237
271
620
161
182
223
704
243
049
YoY Change
55.2%
47.4%
-40.7%
38.8%
8.6%
erating margin
38.2%
48.5%
28.6%
37.1%
35.7%
t profit attributable to equity holders
159
847
224
822
117
483
184
097
203
424
YoY Change
71.3%
40.6%
47.7%
56.7%
-0.6%
t margin
33.2%
40.1%
20.8%
30.5%
29.9%
n-IFRS net profit attributable to equity holders
122
742
123
788
120
117
138
423
165
145
YoY Change
30.1%
0.9%
-3.0%
15.2%
19.3%
n-IFRS net margin
25.5%
22.1%
21.3%
22.9%
24.3%
来源:公司公告,wind
天风证券研究所

